The native coverage overlays are not something new to the Better Internet Dashboard, the basic libraries have been used since April with MS3. What has changed is the way these overlays are managed. Everything from the generation of tiles, the determination of which tiles to build, the cache control, and the formation of our datasets.
The Better Internet Dashboard’s infrastructure has been built cloud-first from the moment it was made public. This has a lot of advantages, but also some complexities.
Building the Dataset
The first major introduction to the Better Internet Dashboard is the logging of successful checks. Our API now handles over a million lookups a month, however, up until now, we only sent this information to the end user. Better Internet Dashboard made no effort into trying to record any of the results.
Now, when a user queries our API, we call our checker library like before however, we have a little extra logic that writes the result to an SQS queue before sending the result to the client. This may not seem overly useful, but, it enables us to build up a dataset based on the lookups the public makes.
Once we have these messages in the queue, we pick them off in bulk every hour. They’re batched up and sent to S3 for archiving. Alongside that, postcodes of the serviceable premises are deduplicated and sent as another object for S3. Since we have the original messages stored in bulk, if we notice an issue with checker logic, we can always replay the results against the logic to check if the provider is serviceable. Enabling us to rebuild the postcode list without making further calls to the providers.

Once a day another job runs that takes the postcode files that have been generated and batches and deduplicates them into a single object. This object is what we use to feed our mapping library.
The Mapping Library
This is something which started in March and has mostly been untouched. The main idea of this library is to take an input of GPS coordinates and output a web tile set.
The logic in this library takes the input of coordinates (which comes from another BIDB library that takes postcodes and outputs latitude/longitude), then determines the tile, the x and y position on the tile, for each level of zoom. With this data, we know exactly which tiles we need and where the spots should exist.
Again, there’s a little extra complexity here. The spots on the tiles are not single points, they can be 10 pixels in diameter, for example, that means in addition, we need extra points outside of the 512px bounds to neighbouring tiles
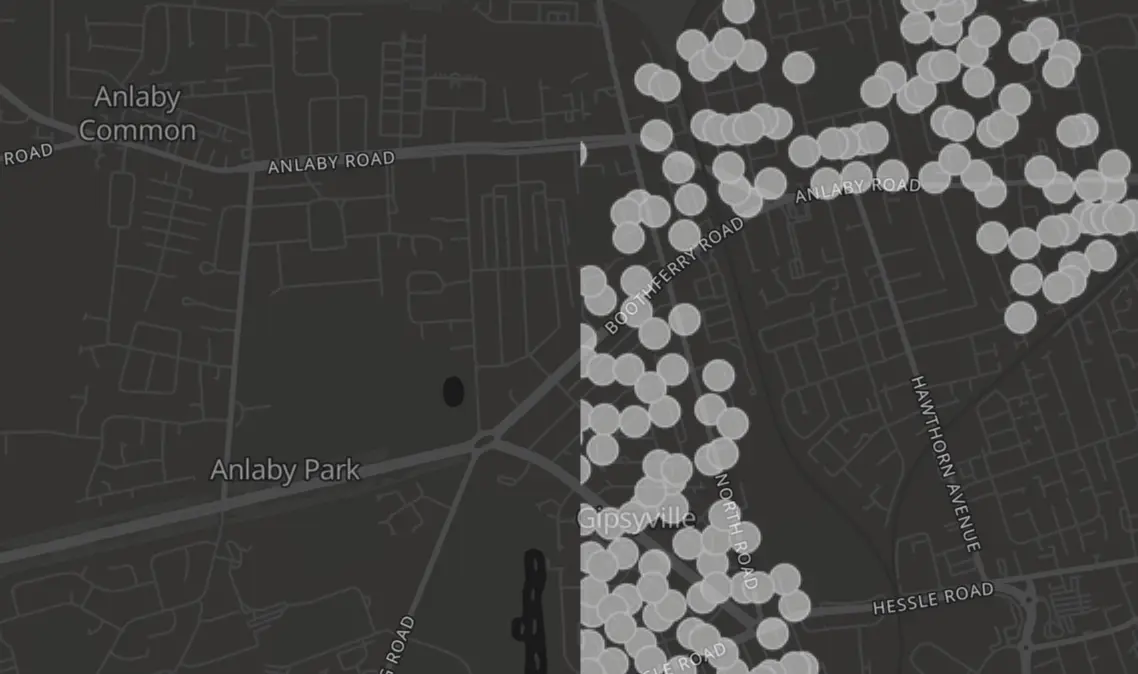
The image here shows how hard a cut-off would be if the circles didn’t leak into the tile to the left.
These tiles can then be uploaded to B2 and served through Cloudflare.
Things have changed since April. First of all, this process can be extremely time-consuming. We’re talking about a large number of images which need to be generated and because of this, it can take hours to build the whole set. But do we need to even build the whole set? Tiles are deterministic, we can run the same job 100 times and get the same images as a result. Because of this we only really need to build points we know to change. For instance, if we know of a new property in London, we don’t need to build up to zoom level 16 in Bristol again. Instead, we just need the delta.
Our mapping library takes the old input as an extra parameter to make this judgement.
Now we have a delta of tiles changed (a job that takes seconds rather than hours in most cases), we can upload these tiles over the old ones. We then make API calls to Cloudflare to granularly wipe the caches of these new tiles.
The “Glue”
Now we have a dataset on S3 and the code to generate and push new tiles. We just need something to invoke it and tie it all together.
This is where we gain great value from GitHub Actions.
Every 24 hours (currently) we run a pipeline that glues all these pieces together.
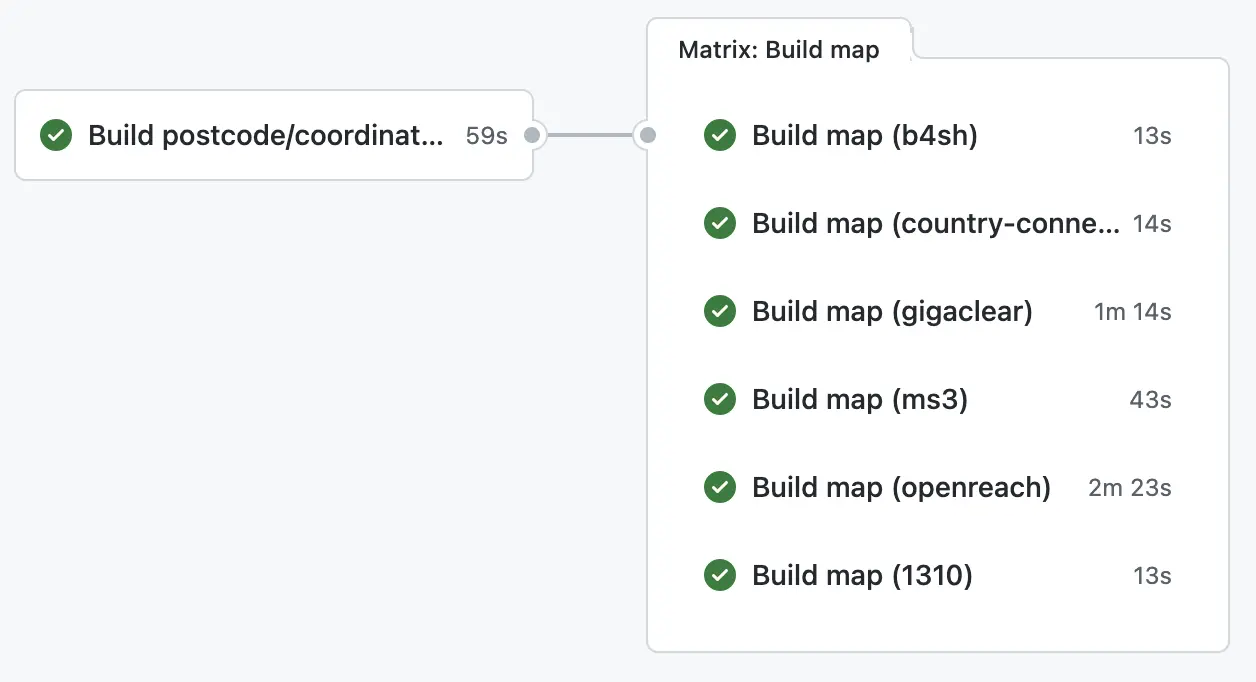
Firstly we run a job that builds a database of postcodes to their coordinates. We do this as the database will naturally grow over time and we want to avoid stale datasets. This output is then pushed to S3.
The pipeline then fans out to every map we build (for instance, one for MS3, one for B4SH, etc). This new job calls our mapping library with the last built dataset (this is something we will upload if the dataset changes) and the new dataset, the job will then determine if we need any tiles.
If this job needs new tiles, it’ll build them with the mapping library. They will then be put onto B2 alongside the input state for future runs, then clear the caches which are relevant for the new tiles.
After this set of jobs has been completed, the new maps are live.
There’s another job that runs after to determine the tile boundaries so that the client doesn’t request tiles a long way away from known existing ones. Though this is not yet implemented on the Better Internet Dashboard.
Seeding the Datasets
Now we come on to a complex topic.
A bunch of providers send us a full list of their serviceable premises or give us (or even build us) an API. These are simple, we just cut down to unique postcodes and we have a map.
The more complex ones require our checkers to be invoked.
We have recently built a very basic Openreach layer. This data is based almost entirely on randomness. We ran a lot of checks against our APIs (these do not contribute to our monthly reports) and that’s all. The mechanisms we already have in place will make sure these are picked up by the map generation the next day.
Openreach is a unique example as it’s nationwide and completely scattered. However, for our other providers, we will utilise our scoping library to make assessments for the seed lookups.
Going Forward
As we seed new provider datasets, we will one-by-one add them to the Better Internet Dashboard.
This outlines our initial phase. Phase 2 will introduce much more targeted seeding, a lot of thinking is going into this area (dare I say ML based?).
“My address is missing from the map?”, yes, probably! You can now resolve this yourself by doing a lookup, it will show up tomorrow!
The incremental maps have been far more efficient than I first expected, so there’s a good chance the update rate will be increased.
If you see any issues with the maps, please use the contact on the Better Internet Dashboard and we’ll fix it!